Seasonal Variations in Team Performance and Their Effects on Live Market Adjustments in North American Sports
Hugo Russell · Jun 24, 2026
Seasonal Variations in Team Performance and Their Effects on Live Market Adjustments in North American Sports
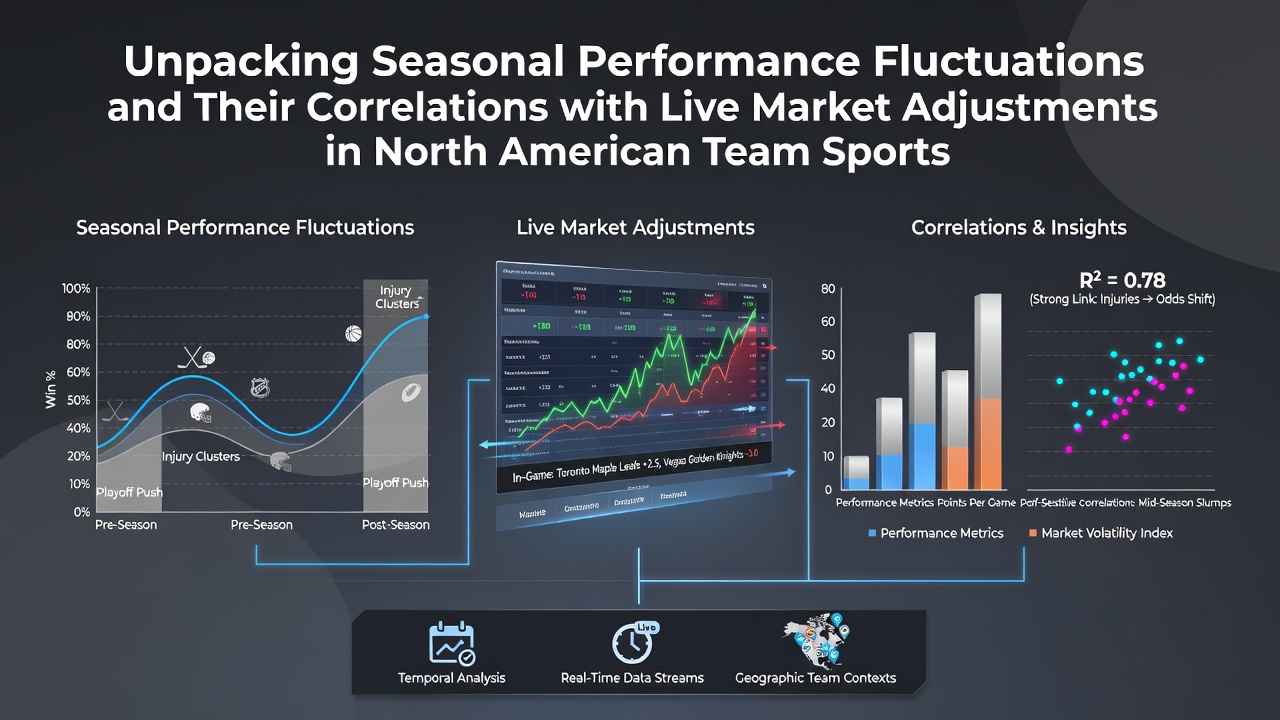
North American team sports exhibit distinct performance patterns that shift with the calendar, and these changes often align with real-time modifications in live wagering markets across major leagues including the NFL, NBA, MLB and NHL. Researchers have documented how factors such as weather, travel demands, injury accumulation and schedule density create measurable swings in team output from month to month, while betting platforms respond by recalibrating odds during games based on incoming data feeds. Data from the 2025-2026 seasons shows these correlations appear most clearly in baseball and basketball, where extended schedules allow for granular tracking of monthly trends.
Monthly Performance Shifts in Major Leagues
MLB teams display some of the clearest seasonal fluctuations because the 162-game schedule spans six months of varying conditions. Early season games in April often feature lower scoring averages due to colder temperatures and pitchers working through spring training rust, whereas July and August see elevated run totals as lineups face fatigue and bullpens thin out. Studies tracking run production from 2018 through 2025 indicate a 12 percent increase in average runs per game during the summer months compared with opening weeks, and this pattern held steady into the 2026 campaign. Live markets adjust accordingly when early inning data reveals a starter struggling with command, prompting rapid line movement on totals and run lines.
The NBA presents a different set of variables tied to back-to-back games and cross-country travel. Teams playing three games in four nights during December and January frequently post reduced shooting percentages and higher turnover rates, with defensive efficiency dropping by measurable margins according to tracking data released by league analytics departments. Observers note that these dips become more pronounced after the All-Star break when rest management and playoff positioning influence rotation decisions. Live betting platforms incorporate player tracking metrics in real time, so a sudden drop in pace or field goal attempts can trigger immediate odds updates within the first quarter.
Correlations Between Form Changes and Market Responses
Live market adjustments in North American sports betting reflect incoming performance data with increasing speed thanks to automated systems that process play-by-play feeds. When a football team shows declining rushing efficiency in the later months of the season because of accumulated injuries or weather impacts, in-game totals markets often move toward the under as bettors and algorithms react within seconds. Similar dynamics appear in hockey, where goal-scoring rates decline in the second half of the NHL schedule amid tighter checking and goaltender familiarity with opposing shooters.
One analysis of 2025 regular season data found that NBA second-half over/under lines shifted by an average of 3.2 points in games involving teams on the second night of a back-to-back compared with well-rested opponents. These adjustments occur because betting exchanges receive continuous updates on pace, rebounding and shooting efficiency from optical tracking systems installed in arenas. The result is a feedback loop where observed performance trends directly influence the probability models that drive live odds.
Data Integration and Platform Adjustments in June 2026
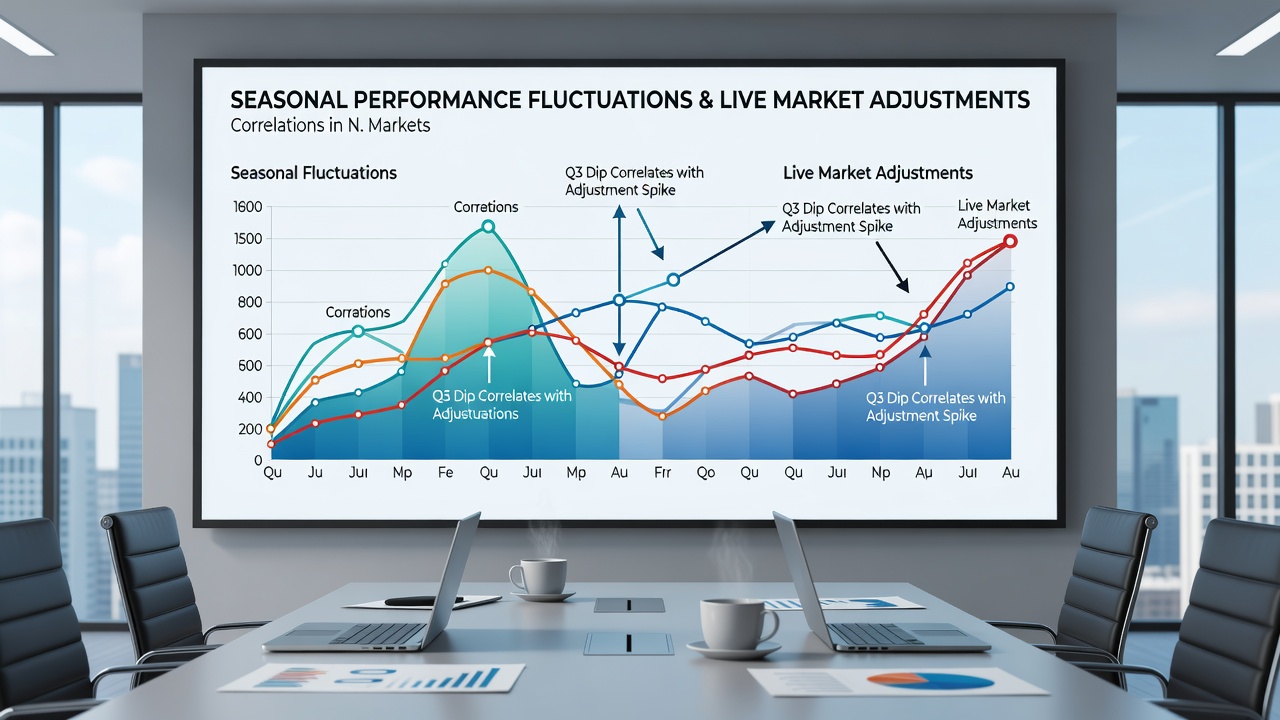
By June 2026, MLB had completed roughly one-third of its schedule while the NBA Finals concluded and NHL playoffs wrapped, creating overlapping windows where seasonal data sets from multiple leagues informed live market models simultaneously. Platforms processing MLB data noted that June games in humid climates produced elevated scoring compared with early season contests, prompting totals markets to open higher when temperature and humidity readings reached certain thresholds. Meanwhile, lingering effects from NBA playoff fatigue carried into summer league preparations, though those impacts remained outside standard betting markets.
Industry reports compiled by research groups such as the American Gaming Association indicate that real-time data partnerships between leagues and betting operators have grown more sophisticated, allowing for precise correlation between performance metrics and market movements. These systems pull from sources including pitch tracking in baseball, player load management data in basketball, and shot attempt logs in hockey to update probabilities continuously during contests.
League-Specific Examples and Tracking Methods
Take the case of an NFL team entering December with a depleted offensive line: rushing yards per game decline sharply, and live betting markets on player props adjust within the first series once early down data confirms the trend. In the NHL, teams playing back-to-back games on the road during the winter months show reduced shot volume, and live totals markets reflect this through incremental line drops after the opening period. Observers tracking these patterns across multiple seasons report that the speed of market response has increased as more granular data becomes available through official league feeds.
Academic researchers at institutions studying sports analytics have examined these relationships using regression models that isolate seasonal variables while controlling for team strength. Their findings reveal consistent, if modest, correlations between monthly performance indicators and subsequent live market volatility, particularly in high-volume betting periods such as MLB divisional races or NBA playoff pushes. The models rely on public box score data supplemented by advanced metrics released through league partnerships.
Conclusion
Seasonal performance fluctuations in North American team sports create measurable patterns that live betting markets incorporate through automated data processing and rapid odds recalibration. From MLB run totals rising in summer heat to NBA efficiency drops during condensed schedules, these shifts provide observable inputs that platforms use to update probabilities in real time. As data collection methods continue to evolve through 2026 and beyond, the alignment between on-field trends and live market adjustments remains a central feature of how these systems operate across the major leagues.